When you’re managing hundreds - or thousands - of products, the challenge isn’t just “why should I buy?” - it’s “how do I find what I need?”.
We drive growth by helping your customers to find their perfect product.

When you’re managing hundreds - or thousands - of products, the challenge isn’t just “why should I buy?” - it’s “how do I find what I need?”.
We drive growth by helping your customers to find their perfect product.
Taxonomy is the key to scaling profitable marketing campaigns. This is a science, not an art - and that’s why we built our proprietary software, Macaroni, to make it happen.
Find out moreWe’re a Shopify marketing agency that draws on deep expertise in data science and software engineering to tackle the toughest challenges at scale.

Sam Wright
Managing Director
Sam is the founder and MD of Blink. He has been working in search engine optimisation since 2007, and is a regular speaker and writer on the subject of eCommerce digital marketing.

James Macnamara
Operations Director
James is a Cambridge graduate in English and Blink's Operations Director. His role is centred on not only making Blink a company delivering exceptional work for clients, but also a forward-thinking, innovative business, and a uniquely rewarding place to be an employee.

Elodie Partridge
Head of SEO
Elodie leads Blink’s eCommerce SEO department. She has extensive experience in international SEO and migrations to Shopify, as well as a passion for sharing knowledge. Elodie is also a native French speaker.

Lauren Harris
Head of Delivery
Lauren oversees Blink’s delivery function, bringing real diligence and expertise to the team, as well as a focus on continually developing and improving our internal processes.

Jess Morgan
Head of PPC
Jess is Blink’s Head of PPC, specialising in Shopify ecommerce growth through Google Ads, Merchant Center feed management, and Meta advertising. She works with brands across a wide range of industries, leading high-performing paid ad strategies that drive scalable ecommerce growth and measurable results.

Andy Russell
Senior Developer
Andy has over 30 years of experience in front and back end development, and has been working with Shopify for well over a decade. His work is essential to the culture of innovation at Blink.

Gideon Clark
Senior SEO Analyst
Gideon brings over a decade of in-house SEO experience to Blink. He is particularly skilled in complex SEO areas such as taxonomy and architecture, and brings a real commercial focus to our analysis.

Bikram Sharma
Content Strategist
Bikram leads Blink's content delivery - a role he is extremely well qualified for given his background as a multi-prize winning writer. Bikram's novel, The Colony of Shadows, was published in 2022.

Michael Witbooi
SEO Manager
Michael brings 13 years of SEO experience to Blink, working across Cape Town and international markets. A curious problem-solver, he's passionate about analytics, human psychology, and solving for Google's "messy middle" in eCommerce AI search.

Sarah Johnson-Laryea
SEO Manager
Originally from the Netherlands, Sarah also has more than 10 years experience in SEO strategy and account management. She is also passionate about advocating for women’s empowerment and gender equality in digital marketing.
The Winning Formula
Your data, whether it's from Google Search Console, Google Ads or Shopify, is telling you exactly what your customers are looking for – and what you are missing.
We combine this insight with advanced AI and behaviour analysis to optimise your existing pages and create new entry points that capture new audiences.

This increases the commercial footprint of your site in a way that works across channels, including organic search, Google and Meta Ads, and email.

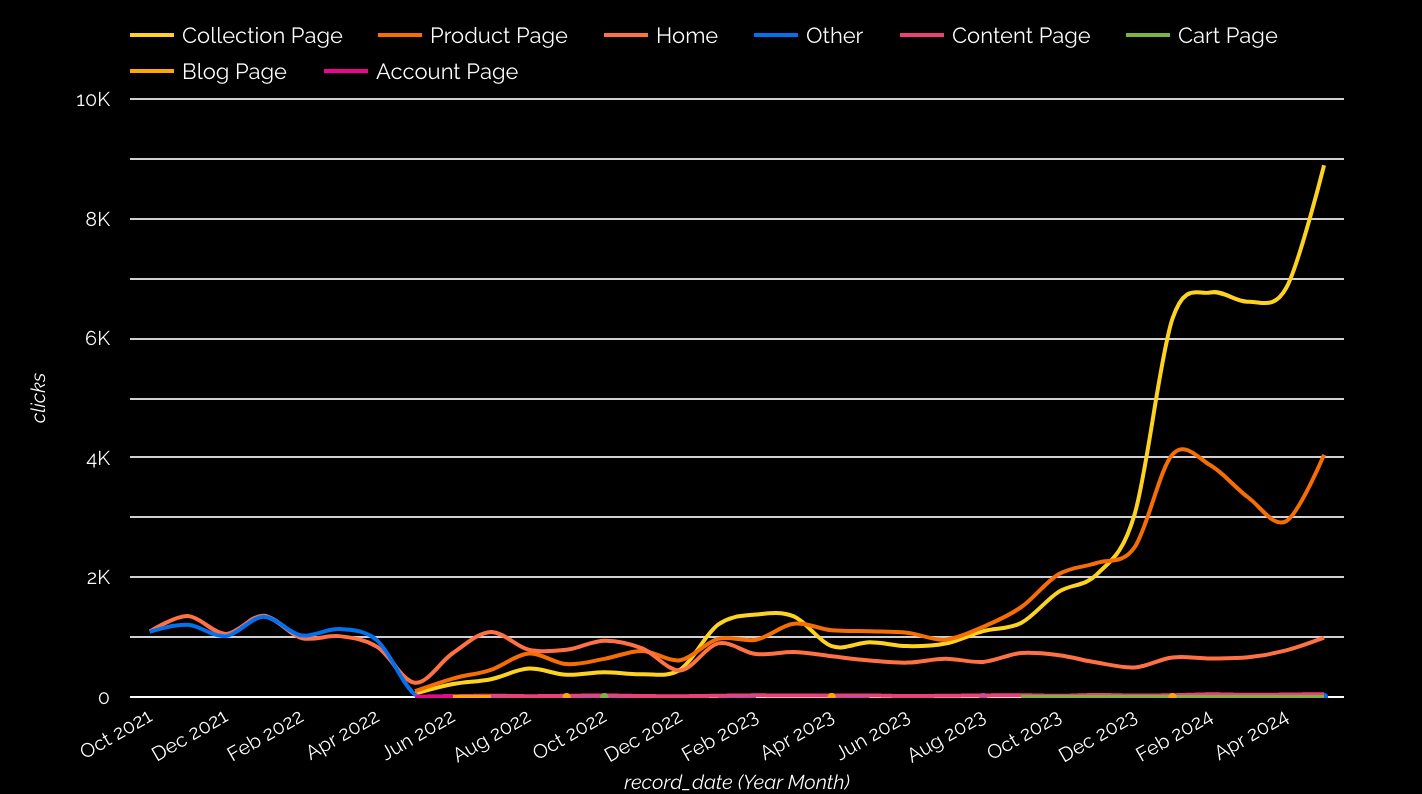
Our data shows that 60% of revenue from organic search and Google Ads arrives from category pages.
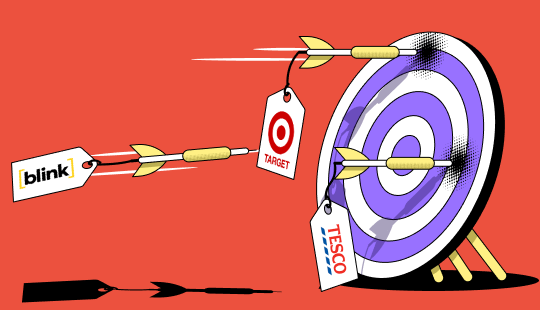
Major retailers from Target to Tesco have used data science techniques to do this for decades.

This means that improving your site’s taxonomy is the fastest and most effective way to grow.

We apply these same methods to eCommerce SMEs, bringing enterprise-level solutions to an eCommerce store like yours.


DATA & technology
Out of the box, Shopify doesn't provide an SEO-friendly faceted navigation solution - so we built one.
DATA & technology
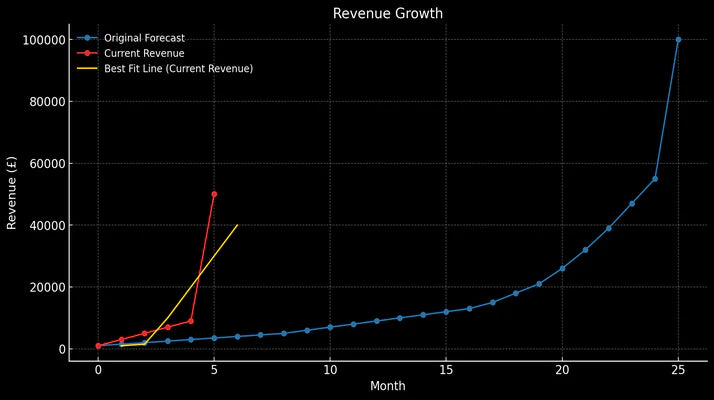
In 2022, a premium furniture brand sought our help to recover from a significant drop after migrating to Shopify. Here's how we did it.
We’re only as good as the results we provide for our clients and partners. Here's what they say about working with us.

Andrew Kemp
CEO
Bare Kind
"Just one week in with Blink, and we've already seen incredible results. By optimising our collections, we've seen massive SEO improvements on most pages. Their expertise is paying off quickly, and I’m excited to see what’s next!"

Max McKenzie
Owner
Better Body Equipment
Blink's team have shown extraordinary professionalism and commitment, but most importantly the results speak for themselves. In just a few months we've seen our organic revenue significantly increase and our rankings skyrocket.

Andrew Kritzer
Co-founder
ModernTribe
"Partnering with Blink has been a game-changer for ModernTribe. They're eager to push the limits, particularly around new development and technology. It's not just SEO; it’s really good overall strategy and execution."

Arnold Bertasius
Marketing Director
Arca Living
"After a major Google update wiped us from the SERPs, their team dug deep, implemented faceted navigation, and in 12 months, we ranked for 10k new keywords —all through pure SEO. You guys are seriously amazing, thank you."

Nathan Lomax
Director & Co-founder
Quickfire Digital
"Working with Blink and the team is always a pleasure. They are proactive, pragmatic and full of knowledge, and we know whenever we are doing a Shopify site migration with these guys the client is in the best hands possible."